August'24: Kamaelia is in maintenance mode and will recieve periodic updates, about twice a year, primarily targeted around Python 3 and ecosystem compatibility. PRs are always welcome. Latest Release: 1.14.32 (2024/3/24)
A Notation For Visualising Axon Systems
Summary:
This document presents a notation for diagrams to describe Axon systems. The notation is intended as both a design tool and documentation aid. Axon allows extraction of the information necessary to reconstruct the design from an active system. An overview of Axon - a software component system - is included.
Keywords: Axon, Component, Software, Architecture, Parallel Processing, Concurrent, Signal Processing, Message Passing
1 Essential Elements of an Axon System
Axon is a component system for creating large-scale highly parallel
software systems. The system is designed to operate efficiently inside a
single operating system process. (This is equivalent to a cook handling
many tasks, rather than many cooks with many tasks.)
A system in Axon has the following key elements:
- Components
- Inboxes
- Outboxes
- Linkages
Components perform processing in parallel with other components. A component contains inboxes and outboxes. Inboxes are used by components to receive messages. After processing, the results are placed into an outbox.
Components may contain other components forming systems. Messages pass between components along linkages which join outboxes to inboxes. (More specifically linkages join data sources to data sinks) This is analogous to internal mail inside an organisation and having the postman know where messages should be delivered.
Components normally perform processing by providing a means of
handling a "pausable" function. Such functions voluntarily pause
themselves using a form of return & continue functionality provided
by the language. As a result components are simply objects with lists of
inboxes, outboxes and a wrapper for a pausable function. Users of the
system customise components by providing alternative functionality for
the various parts of the pausable function (initialisation, main loop,
shutdown).
2 Overview of Notation
The purpose of this notation is to aid the following:
- Accessibility
Design
- Documentation
There are 3 main types of diagram this notation covers:
- Black box diagrams for single components. These show the external view of the component.
- Glass box diagrams for component systems. These are used when a
component contains other components, forming systems. These diagrams
make this internal structure between subcomponents visible.
- Lifecycle diagrams. These are a sequence of glass box diagrams
showing how the component system changes with time.
It's worth noting that black box diagrams are used on glass box
diagrams, and that both black & glass box diagrams are used on
Lifecycle diagrams.
2.1 Black Box Single Component Static View
Figure 1 shows a black box view. This form of view does not contain any linkages, and simply shows public inboxes and outboxes. The notation provides clear differences between inboxes and outboxes.
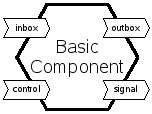
Figure 1
Things to note regarding this diagram:
- The boundary of the component we are describing has a thick hexagonal boundary.
- Inboxes are indicated as essentially "arrow lines"pointinginto the component.
- Outboxes are indicated as essentially "arrow lines"pointingout from component.
- This only shows the external view of the object. No private/internal
inboxes or outboxes are represented in this diagram.
Figure 2 describes a sample existing component. A network server uses
this component to send and receive data to a specific, already
connected, client. For each connected client there is one connected
socket adaptor.
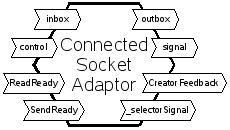
Figure 2
This component has the following inputs and outputs:
- 4 inboxes for receiving messages from other components
- 4 outboxes for sending messages to other components
- Private to the component is a connected socket
The connected socket forms a functional communication link to a
system outside Axon. This behaviour is represented in the name of the
component - it is the reason the component is called an adaptor.
Similarly a component designed to read from a file could have a
single outbox, and no inboxes. Internally such a component would have a
filehandle for reading data. In such a scenario, the filehandle would be
created at component creation time. As data is made available this could
be passed to the component's outbox. Due to the input from a non-Axon
system, a file reader component operating in this manner would also be
an adaptor.
A component that wrapped up all interaction with a GUI could have inboxes for receiving details of items to display, and outboxes for describing user events and input. This would also be an adaptor since it would be transforming input/output between the Axon system and the GUI system.
- A component can have no outboxes. This means the component is likely to produce output some other way - as audio, video, text to a screen, file, to a network connection, etc.
- Components can also have no inboxes. Such components can take input
from another source - such as from a file, network connection, keyboard,
GUI, etc.
2.2 Glass Box Component System Static View
In the majority of cases, a glass box view will essentially be a
snapshot of the system at a given point in time.
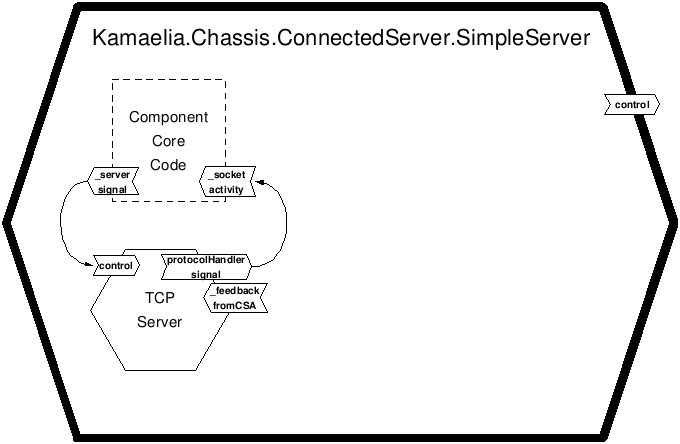
Figure 3 shows a rather complex glass box view.
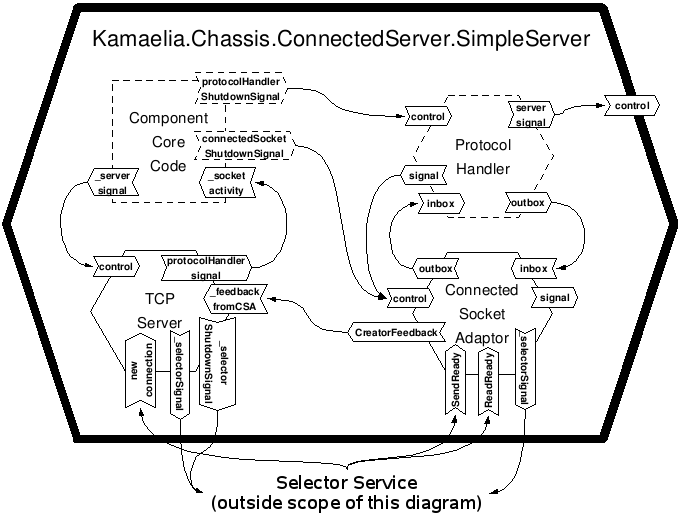
Figure 3
This diagram contains the following visual cues:
Once again, the border of the component being described has a thick hexagonal outline.
- For a toplevel component whose internals are being shown, a thick
rectangular outline can be used instead to maximise drawing space!
Public inboxes/outboxes are shown on the border of the component.
Private/internal inboxes or outboxes are shown as attached to the
code running the component. The names are all preceded by an
underscore.
We have represented the code of the component itself as a labelled hexagon with a dotted outline. If the component has no private inboxes/outboxes, we could omit the code representation from the diagram.
Linkages are indicated by arrows.
Subcomponents are indicated by hexagonal shapes.
Subcomponents defined at runtime, using the same interface, are shown
with a dashed border.
- Note: Such things are generally a configuration
option when creating the component!
There are clearly things going on here that are outside the scope of
this component.
(Note this component has no outbox - output to an end-user is via the
connected socket adaptor.)
The reasons for using this notation is as follows:
The region we are defining is clear and follows the same notation as a black box interface definition.
Subcomponents are shown in a different shape to indicate that this
diagram does not define them. It defines their usage in a particular
context.
Indicating a subcomponent with a dashed border indicates that we are not specifying a particular component in that section. We are defining that a component matching that interface will go there at runtime. Specifically this also requires that we have a method for changing which component this is at runtime.
Items are defined by functionality in these diagrams. Since all any linkage does is provide structure to the system, and indicate flow of messages, all linkages are drawn the same. That is all the linkages are shown as arrows. However it should be clear from the diagram that linkages fall into 3 categories:
- Linkages between outboxes and inboxes.
- Linkages from a parent component inbox directly to a subcomponent's
inbox.
- Linkages from a subcomponent's outbox to a parent component's outbox.
One way of thinking about this is much like how a comic show time based events!
2.3 Lifecycle Dynamic System View
Lifecycle/dynamic views are presented as a sequence of glass box
diagrams. The purpose of a lifecycle/dynamic system view is to clearly
present how the system changes with time. Since the structure of the
system is extractable from an active system verification that the system
is following expected behaviour is potentially checkable visually.
There is no additional notation added for dynamic systems. There is
one major difference though: whilst a static view may have subcomponents
with dashed borders, a dynamic/lifecycle diagram in general will not. A
dashed border for a component indicates this component will be defined
at runtime. A dynamic/lifecycle diagram as a whole indicates how the
system works when it's running. Unless the entire system is
parameterisable (which is possible), there will normally be no
subcomponents with dashed borders.
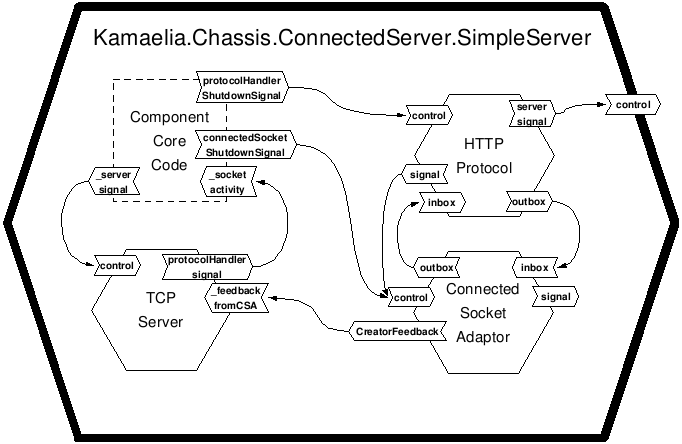
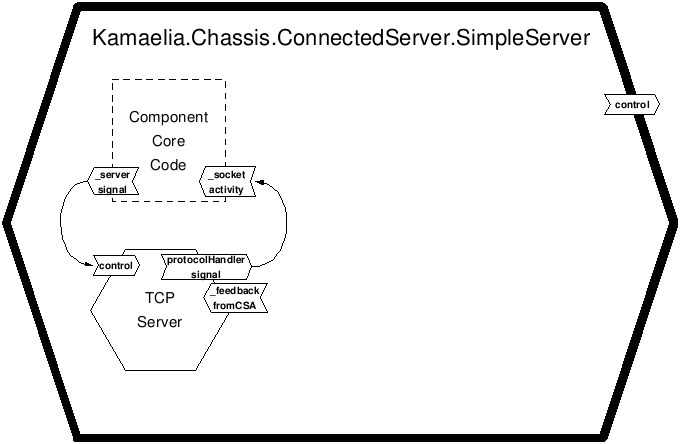
An example HTTP server component could follow the following
lifecycle:
- The server component would be created:
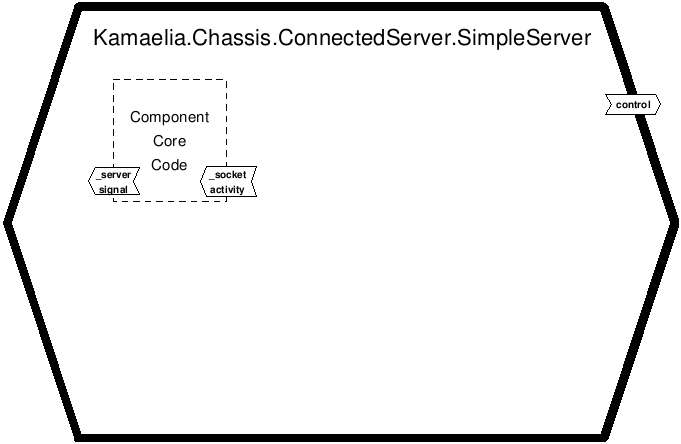
- The server would allocate a listener:
- A client would connect, the server allocates a protocol handler and
makes linkages:
- The client disconnects, the protocol handler & connected socket
handler are discarded, and the server listens for new connections:
Steps 3 & 4 then repeat.
Valid reasons (non-exhaustive) for breaking these rules are:
- You're linking all outboxes to inboxes of the next component
- Simplicity - you're writing a tutorial and want to skip details
- Sanity - where it'd be mad to follow the rules
- Experimentation - you're trying something new :)
3 Summary
This document has presented a notation for diagrams describing Axon
components and systems. A summary of the notation is below. (it uses
SHOULD/MUST /MAYin the same was an an RFC)
For all Axon diagrams:
The component being described/defined MUST be represented using a thick black border, and SHOULD use a hexagonal border.
Inboxes SHOULD be represented using arrow box-lines, pointing into
the component.
Outboxes SHOULD be represented using using arrow box-lines, pointing out from the component.
- The only exception of inboxes & outboxes is where the
diagram would look unnecessarily complicated - if that's the case
inboxes/outboxe MAY just the ends of a linkage.
Public inboxes/outboxes MUST be attached to the border of the
component.
The following applies to glass box diagrams:
- Subcomponents, linkages, and private inboxes/outboxes SHOULD only
appear on glass box diagrams.
- Private inboxes/outboxes SHOULD have a preceding underscore in their name and MUST be attached to a representation of the code.
- Subcomponents MUST be represented using hexagons.
- Subcomponents MAY be represented using a dashed border to indicate that a variety of subcomponents with identical inboxes/outboxes can be used in its place at runtime.
- Linkages MUST be indicated using arrows.
- The top level component MAY have a rectangular border to help with drawing space!
Lifecycle diagrams:
- Indicate how the system will function at run time
- Are generally glass box, rather than black box
- Rarely contain subcomponents with dashed borders, unless the entire system is parameterisable at runtime
Why use MAY/SHOULD/MUST? This notation forms a simple language, and
by using it consistently we make it easier to pick up and run with
Kamaelia systems.
Discussion
This document was used in Kamaelia development for a number of years, and has been refined over time.
